

Recruitment metrics are the numbers that describe how hiring runs, from time to fill and cost per hire to offer drop, joining ratio and hiring manager response time. A KPI is a metric with an owner and a target. This hub gives twelve formulas, the benchmarks that exist with their sources, which numbers agencies and in-house teams own, and how an RMS reports them without a spreadsheet.
Key takeaways:
- Twelve metrics cover every stage from requisition to joining. Pick the four that match your bottleneck and ignore the rest for a quarter.
- A metric without an owner is a report. Give each number a name and a target before it goes on a dashboard.
- India's hiring funnel breaks after the offer. Track joining ratio, not just offer acceptance.
- Agencies and in-house teams share six metrics and own three each. Report the right set to the right person.
- Most of these numbers come free from an RMS that time-stamps every stage. The rest need one definition agreed in writing.
Every guide to recruiting metrics lists the same ten and stops (Teamdash). The better ones answer who should care about which number (Workable). None gives the formulas beside benchmarks you can cite, none covers the offer-to-joining gap that defines hiring in India, and none separates what a staffing agency tracks from what an in-house team tracks. This is the hub post for that: twelve formulas, the benchmarks with their sources and dates, a persona table, and how to build the dashboard so the numbers appear without a Saturday in Excel. Our post on time to fill vs time to hire goes deeper on the first two.
What recruitment metrics are, and the difference between a metric and a KPI
A metric is a measurement: 38 days from requisition to accepted offer. A key performance indicator is a metric someone owns with a target attached: time to fill under 35 days for engineering roles, owned by the engineering recruiter, reviewed monthly. Teams that put twenty metrics on a dashboard have twenty reports. Teams that pick four KPIs have four conversations a month. The list below is the menu, not the dashboard.
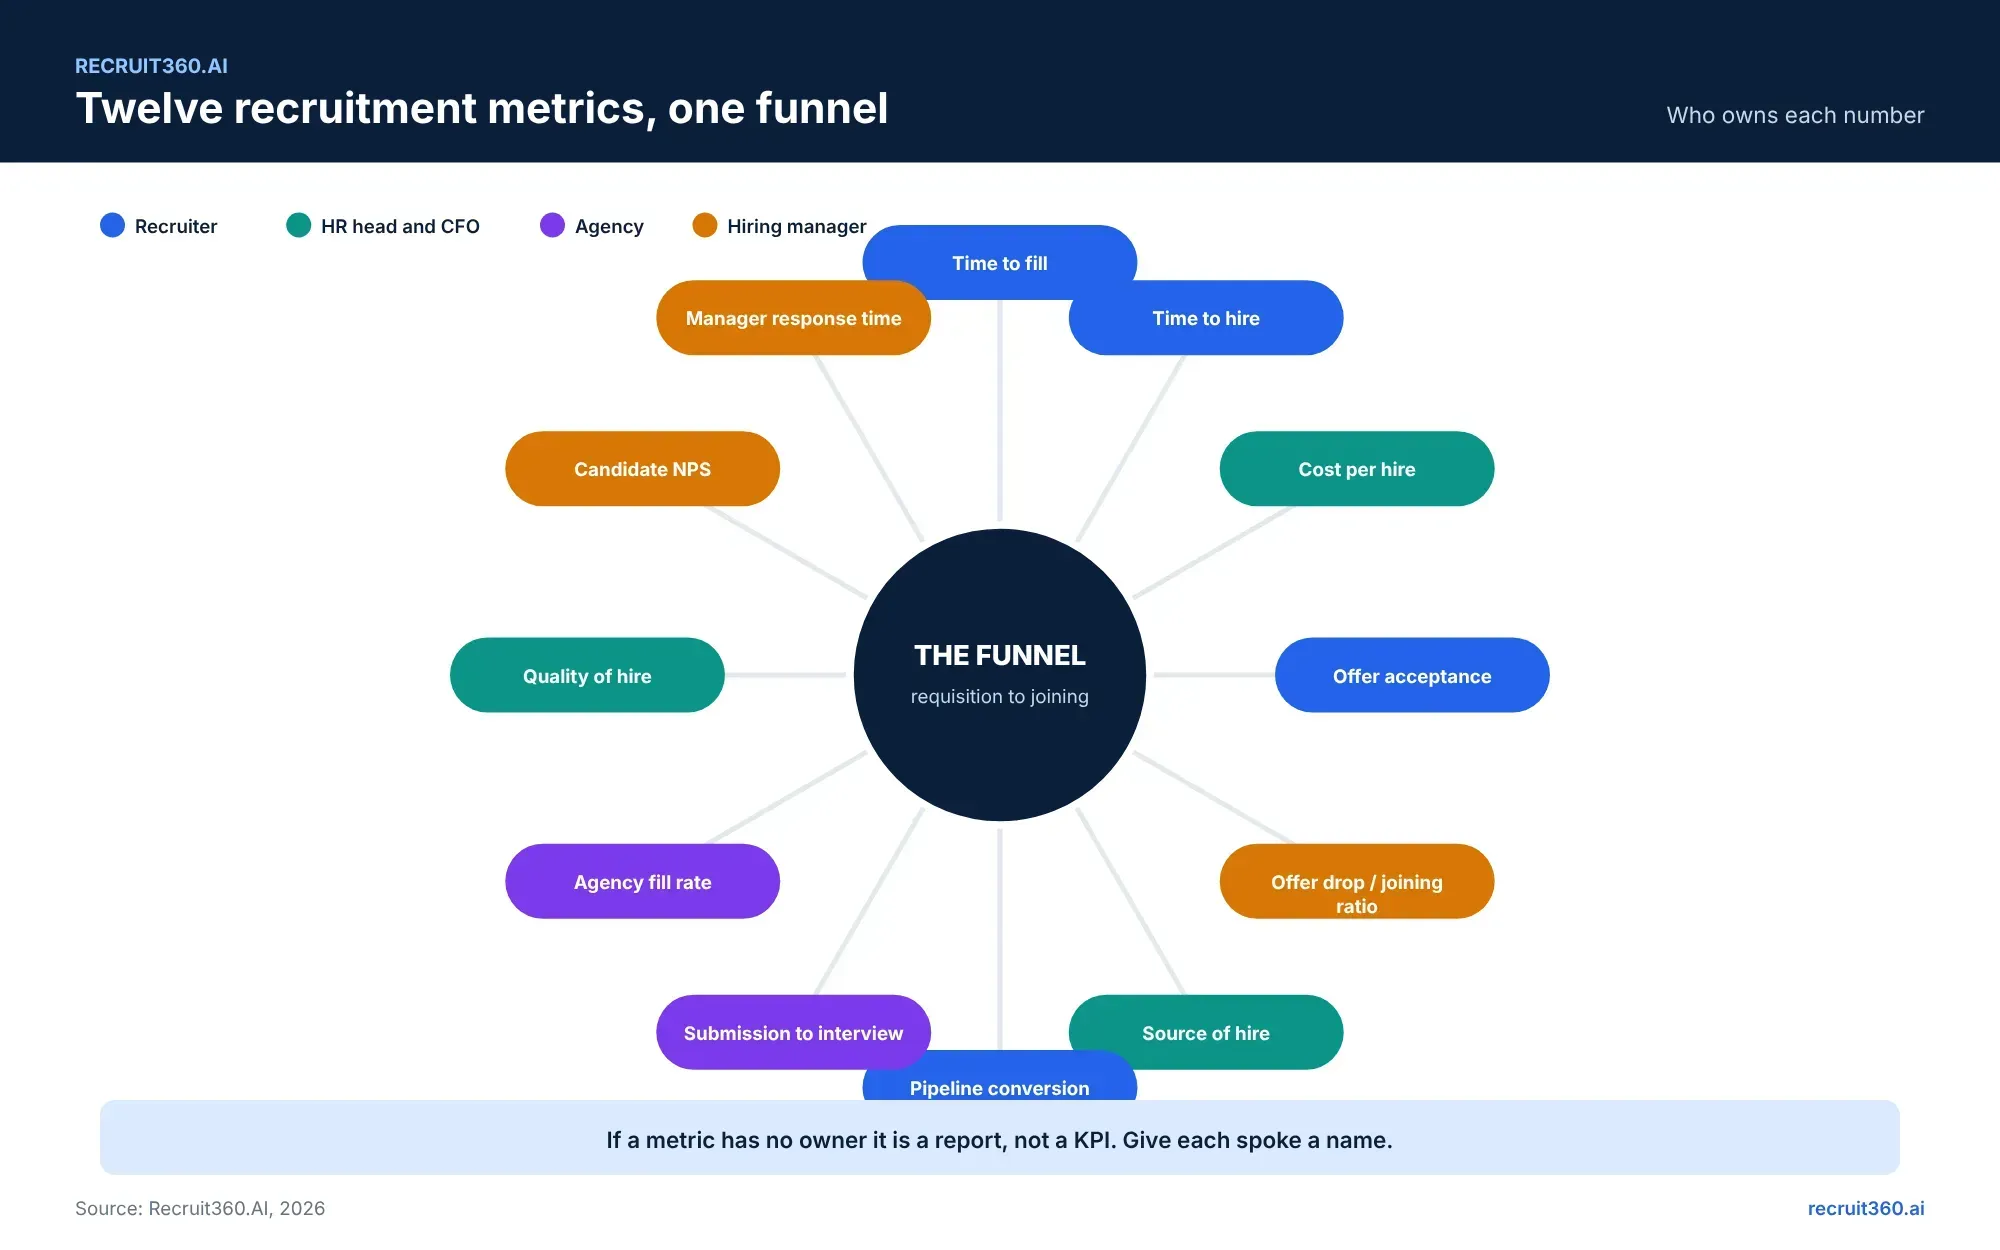
The 12 recruitment metrics that matter
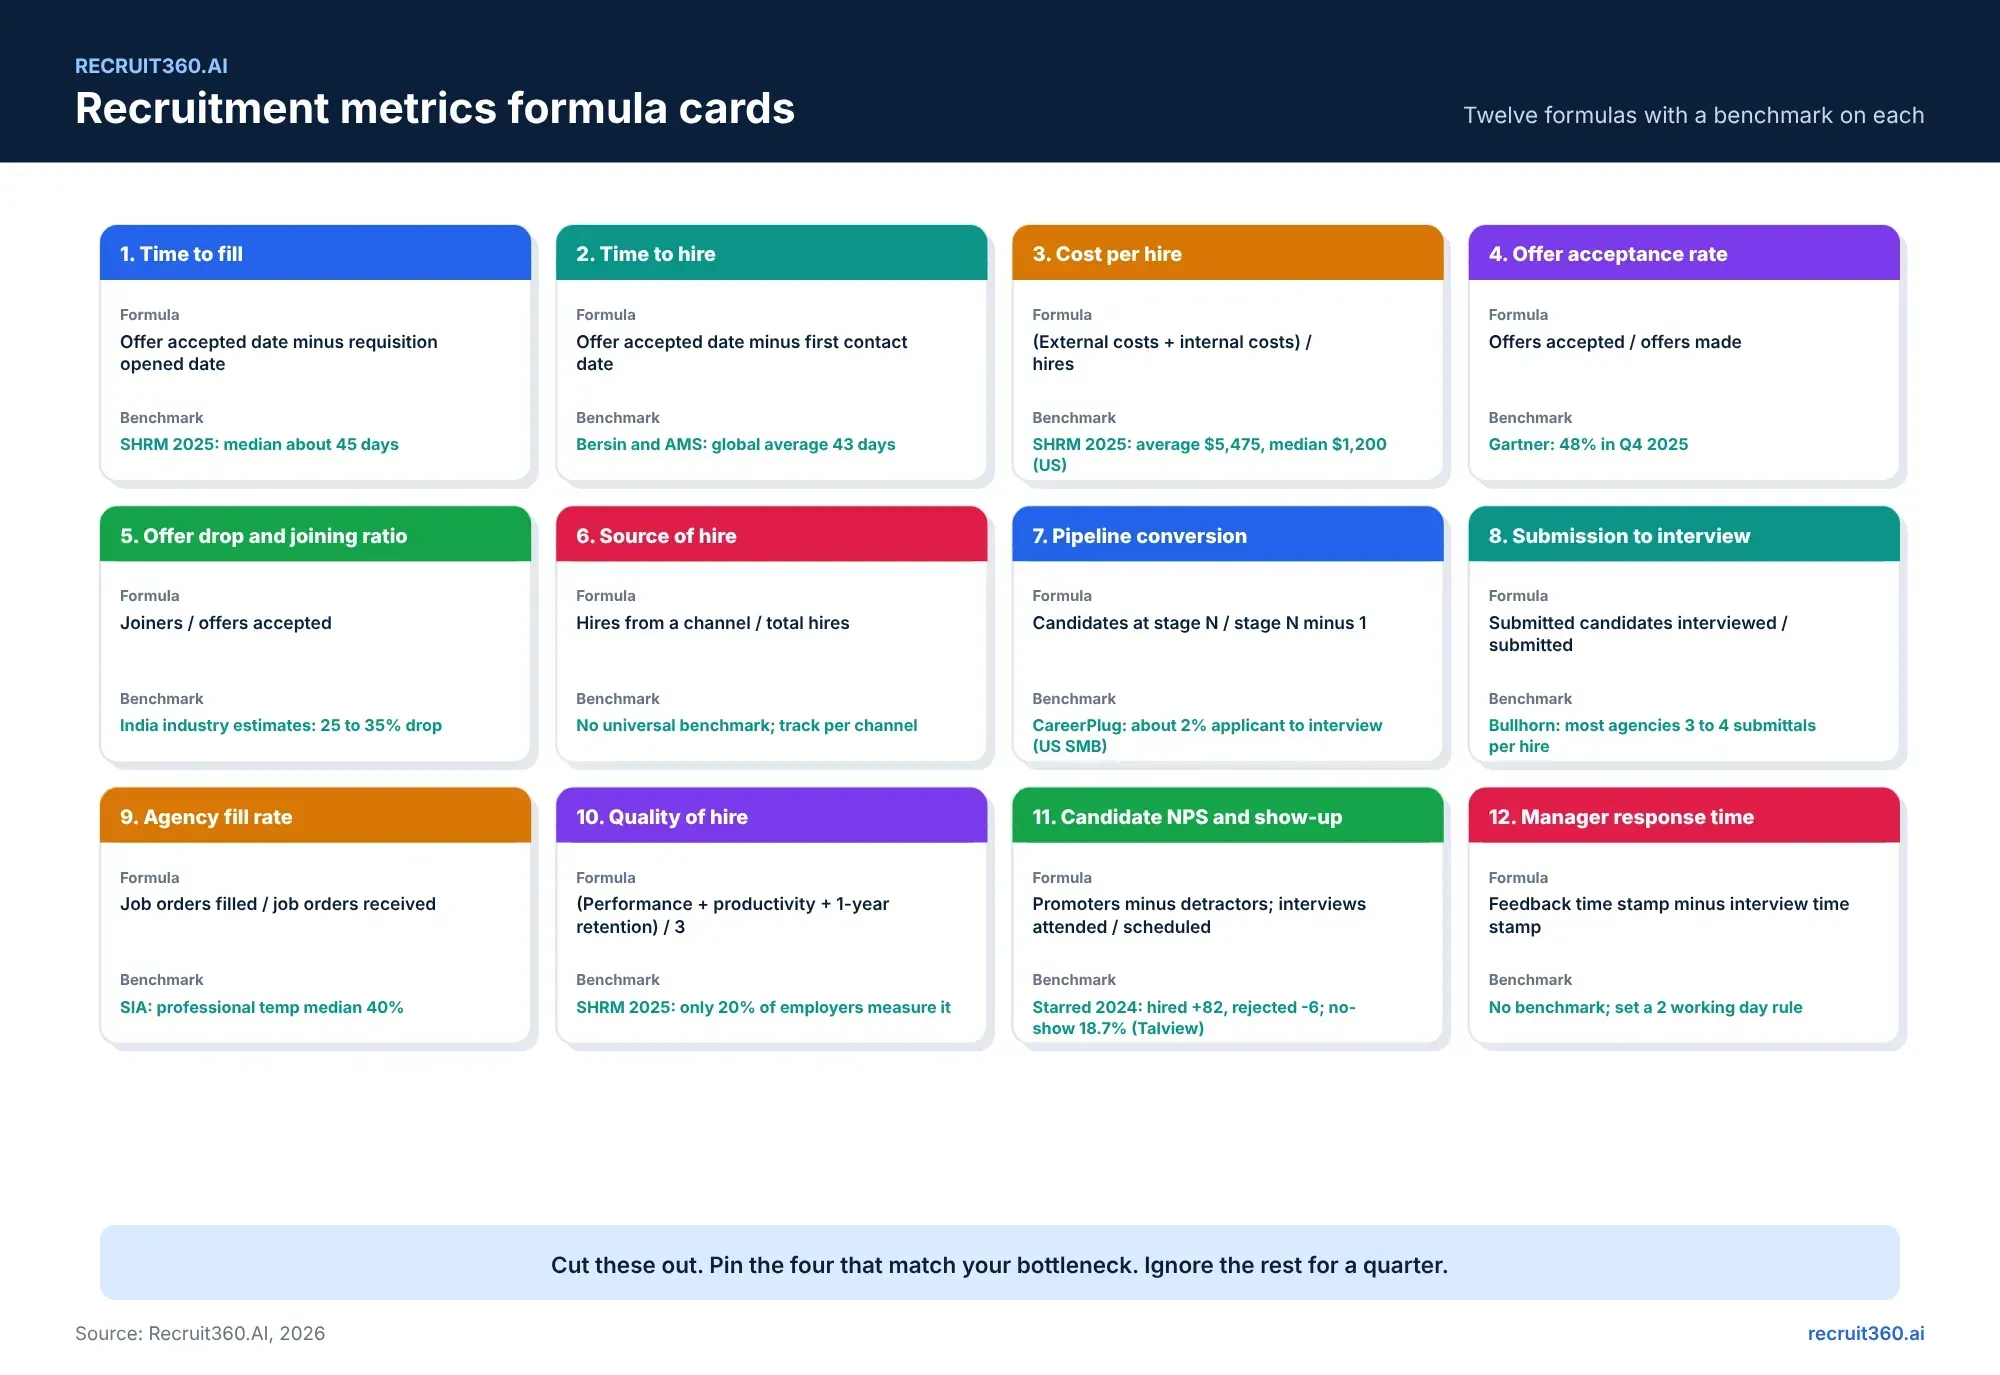
Each entry gives the definition, the formula, a benchmark with its source and date, and the lever that moves it. Benchmarks are mostly US or global because that is where the published surveys are; India-specific figures are marked where they exist.
1. Time to fill
Days from the requisition being opened to the offer being accepted, weekends included. SHRM's 2025 median is about 45 days. In India, add the notice period. The formula, a worked example, the India adjustment and who should see the number are in time to fill vs time to hire, the child post of this hub.
2. Time to hire
Days from first contact with the person you hired to their accepted offer; it measures the process, not the vacancy. Global averages sit near six weeks. The same child post covers the formula, why time to hire and time to fill diverge, and which to report to whom.
3. Cost per hire
Formula, from the ANSI/SHRM standard: (external costs + internal costs) divided by total hires in the period. External costs are agency fees, job boards, advertising, assessments, travel and relocation; internal costs are recruiter salaries, TA systems and referral bonuses . Benchmark: SHRM 2025 reports an average of $5,475 for non-executive hires and a median of $1,200; the average for executives is $35,879. India: no published benchmark in rupees was found; calculate your own with the same formula and compare quarter to quarter.
4. Offer acceptance rate
Formula: offers accepted divided by offers made. Benchmark: Gartner found 48 per cent of candidates accepted their most recent offer in the fourth quarter of 2025, down from 54 per cent a year earlier and 85 per cent in 2023. What moves it: offer speed, salary alignment set at screening, and how many offers the candidate holds.
5. Offer drop rate and joining ratio
The India metric. An accepted offer is not a hire until the person walks in. Formula: joining ratio = joiners divided by offers accepted; offer drop rate = 1 minus joining ratio. Benchmark: there is no SHRM standard. Indian industry estimates put offer drop at 25 to 35 per cent in most sectors; an older en world survey found IT candidates declined 32 per cent of offers. Treat both as estimates and measure your own. What moves it: contact during the notice period, a joining date the candidate chose, and Agent Calling or WhatsApp check-ins at week two and week six.
6. Source of hire
Formula: hires from a channel divided by total hires, with cost per channel beside it. No universal benchmark; the useful comparison is channel to channel inside your own data. What moves it: which channels get the budget. In India the channels are Naukri, LinkedIn, referrals, agencies and the internal database, and an RMS that stamps the source on every candidate makes this automatic.
7. Applicants per opening and pipeline conversion by stage
Formula: candidates at stage N divided by candidates at stage N minus one, for every stage. Benchmark: CareerPlug's 2025 report on US small businesses found about 2 per cent of applicants reach interview and about 27 per cent of interviews lead to a hire. Appcast data via SHRM found 92 per cent of people who click apply never finish the application . What moves it: application length and screening accuracy; see AI resume screening.
8. Submission to interview ratio (agency)
Formula: submitted candidates who were interviewed divided by candidates submitted. Benchmark: no universal figure; Bullhorn's survey of Australian agencies found 40 per cent run at three to four submittals per hire and 24 per cent at four to five . What moves it: intake quality. Three rejections for the same reason mean the requirement sheet was wrong.
9. Agency fill rate and time to submit (agency)
Formula: job orders filled divided by job orders received ; time to submit is requirement received to first submission. Benchmark: Staffing Industry Analysts' North America survey found a median fill rate of 40 per cent for professional temporary roles and 65 per cent for commercial, with a median nine days to offer acceptance for professional temp . What moves it: client tiering and recruiter allocation; see how staffing agencies manage multiple client requirements.
10. Quality of hire (90-day and 1-year)
Formula, Workable's version: (performance rating + productivity + one-year retention) divided by three, each on the same scale . Benchmark: SHRM 2025 found only 20 per cent of organisations measure it at all. What moves it: structured interviews and the same scorecard on every candidate.
11. Candidate NPS and interview show-up rate
Formula: promoters minus detractors on a 0 to 10 question, and interviews attended divided by interviews scheduled. Benchmark: Starred's 2024 data puts candidate NPS at +82 for hired candidates and minus 6 for rejected ones ; Talview's platform data from 93,783 interviews shows an overall no-show rate of 18.7 per cent, rising to 28 per cent when the interview is scheduled less than 24 hours ahead. What moves it: scheduling lead time, reminders on WhatsApp, and telling rejected candidates why.
12. Hiring manager response time
Formula: feedback time stamp minus interview time stamp, averaged per manager. No published benchmark; the common rule is two working days. What moves it: a scorecard inside the system with a reminder, and a monthly report that names the slowest manager. This is the metric most teams cannot produce because the feedback lives in email.
Recruitment KPI benchmarks for India: what exists and what does not
Published benchmarks are mostly US and global; every figure here was read on 15 October 2026. Where an Indian figure exists, it is listed with its source and age; where none exists, the table says so rather than inventing one. Use the global figure as a reference point and your own last two quarters as the real benchmark.
| Metric | Published benchmark | India figure | Source and year |
|---|---|---|---|
| Time to fill | Median about 45 days | None published; add 60 to 90 days of notice period for mid and senior roles | SHRM 2025; notice period practice (TCS moved to 90 days in 2016, People Matters) |
| Time to hire | 43 days global average | None published | Bersin and AMS, 2022 data |
| Cost per hire | $5,475 average, $1,200 median (US) | None published | SHRM 2025 |
| Offer acceptance | 48 per cent | None published | Gartner, Q4 2025 |
| Offer drop | Not a standard metric | 25 to 35 per cent, industry estimate; 32 per cent for IT in an older survey | Taggd citing Mint, 2022; en world via People Matters, 2018 |
| Pipeline conversion | About 2 per cent applicant to interview; 27 per cent interview to hire (US small business) | None published | CareerPlug 2025 |
| Application completion | 8 per cent of apply clicks finish | None published | Appcast via SHRM, 2022 |
| Agency fill rate | 40 per cent professional temp; 65 per cent commercial | None published | SIA, 2021 data |
| Interview no-show | 18.7 per cent overall | Platform data without a country split | Talview, 2025 |
| Candidate NPS | +82 hired, minus 6 rejected | None published | Starred 2024 |
| Market context | Naukri JobSpeak index 3,053 in September 2026, up 2 per cent year on year; AI and ML roles up 20 per cent | India | Naukri, October 2026 |
Sources are listed in full at the end of the post.
Agency KPIs vs in-house KPIs: which to report to whom
| Person | KPIs to report | Why |
|---|---|---|
| Recruiter | Time to hire, pipeline conversion, submissions per hire, hiring manager response time | The numbers they can move this week |
| Hiring manager | Time to fill for their roles, their own response time, offer acceptance | Their delays are usually the bottleneck |
| HR head or TA lead | Time to fill by department, cost per hire, source of hire, quality of hire, joining ratio | The quarterly story and the budget |
| CEO or CFO | Cost per hire, time to fill against plan, offer drop | Money and risk, one page |
| Agency owner | Time to submit, submission to interview ratio, fill rate by client, client feedback delay | Which client to call first |
| Agency client | Submissions within limit, time to submit, placements | The report that renews the contract |
Agencies and in-house teams share time to fill, time to hire, pipeline conversion, source of hire, offer acceptance and joining ratio. Agencies add time to submit, submission to interview and fill rate. In-house teams add cost per hire, quality of hire and hiring manager response time. Report the shared six to everyone and the extra three to the people who own them.
How to build a recruitment dashboard in an RMS
A recruitment management system time-stamps every stage change, so most of the twelve are automatic: time to fill, time to hire, pipeline conversion, source of hire, offer acceptance, submission ratios, fill rate and manager response time appear without anyone typing a date. Three need a definition agreed in writing before the dashboard is built. Cost per hire needs the list of internal and external costs and who enters them. Quality of hire needs the performance scale and the review date. Joining ratio needs a joining date recorded on the offer, which is the field most teams forget. Agree those three, pick four KPIs with owners, and the dashboard is a filter, not a project. Recruitment automation covers the stage triggers that make the time stamps reliable.
Five mistakes teams make with recruiting metrics
Tracking twenty metrics and owning none. Measuring offer acceptance and stopping, when the candidate has not joined. Comparing your time to fill with a US benchmark without subtracting the notice period. Reporting the same dashboard to the CFO and the recruiter. Calculating cost per hire once a year, by hand, with a different formula each time.
Upshots: how Recruit360.AI reports these metrics
Recruit360.AI records a time stamp on every stage, so ten of the twelve metrics are on the analytics dashboard from the first requisition, filtered by department, recruiter, client, source and agency. The offer record carries the joining date, so joining ratio and offer drop are reported alongside acceptance. Hiring manager response time is measured from the scorecard inside the system. Cost per hire and quality of hire take the two definitions above and a field each. Agency clients get their own view of submissions, limits and placements through the vendor portal. The free trial runs on live roles, which means the first dashboard you see has your numbers on it.
Frequently asked questions
What are the most important recruitment metrics?
Time to fill, time to hire, cost per hire, offer acceptance rate, joining ratio, source of hire and pipeline conversion cover most teams. Agencies add time to submit, submission to interview ratio and fill rate. Pick four with owners rather than tracking all twelve.
What is the difference between a recruitment metric and a KPI?
A metric is a measurement. A KPI is a metric with an owner and a target, reviewed on a schedule.
How do you calculate cost per hire?
Add external costs (agency fees, job boards, advertising, assessments, travel, relocation) and internal costs (recruiter salaries, systems, referral bonuses) and divide by the number of hires in the period. This is the ANSI/SHRM standard formula.
What is a good time to fill?
SHRM's 2025 median is about 45 days. In India, add the notice period: 60 to 90 days is common for mid and senior roles. Compare against your own last two quarters rather than a global number.
What is the joining ratio?
Joiners divided by offers accepted. Offer drop rate is one minus the joining ratio. Indian industry estimates put offer drop at 25 to 35 per cent; measure your own by recording the joining date on every offer.
What is offer acceptance rate and what is a good one?
Offers accepted divided by offers made. Gartner found 48 per cent of candidates accepted their most recent offer in late 2025, down from 85 per cent two years earlier. Speed and salary alignment at screening move it most.
Which recruitment metrics should a staffing agency track?
Time to submit, submission to interview ratio, fill rate by client, client feedback delay, plus the shared metrics: time to fill, pipeline conversion, source of hire and joining ratio.
How do you measure quality of hire?
One common formula averages performance rating, productivity and one-year retention on the same scale. Only 20 per cent of organisations measure it at all, according to SHRM 2025, because it needs a definition agreed with the business first.
What is a good interview no-show rate?
Talview's platform data shows 18.7 per cent overall, dropping sharply when interviews are scheduled 24 to 72 hours ahead. Reminders on WhatsApp and self-service slot booking move it.
Can recruitment software calculate these metrics automatically?
Most of them, yes. A recruitment management system that time-stamps every stage produces time to fill, time to hire, conversion, source of hire, offer acceptance and agency ratios automatically. Cost per hire, quality of hire and joining ratio need a definition and a field each.